National Broadband Map has Helped Chart Broadband Evolution
NTIA staffer Anne Neville, Director, State Broadband Initiative
Published: March 23, 2015
When NTIA launched the National Broadband Mapin 2011, American consumers and businesses had few places to turn to when trying to determine who offered broadband in their communities. The National Broadband Map has not only filled that void but has helped detail the evolution of broadband in the United States as providers upgrade or expand their networks to meet the growing demand for faster broadband.
For the last five years, each state, territory and the District of Columbia has collected the broadband availability data that powers the National Broadband Map with the help of grants funded by NTIA through the 2009 American Recovery and Reinvestment Act. Every six months, states have submitted to NTIA data compiled from information gathered from broadband providers, public and commercial data, consumers and local governments. Today, we are releasing updated broadband map data, current as of June 30, 2014.
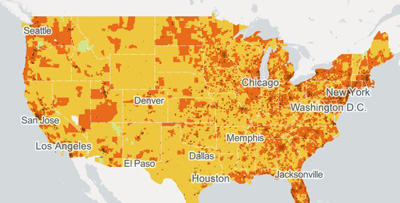
This map displays availability of higher broadband speeds across demographic characteristics
The broadband map has become a vital tool for consumers, businesses, policy makers and researchers by providing an easy to use and searchable way to find out who is offering broadband, what types of broadband they are offering and where are they providing it. With our partners, we built a comprehensive data set that uses information from broadband providers, local communities, public and private datasets and on-the-ground verification. The map has provided data that helped save jobs in rural Utah, bring jobs to Kansas, and connect small businesses in New York. Over the last four years, the map has had more than 8.7 million hits and developers have queried our APIs (application programming interfaces) more than 960 million times.
The most significant finding from the latest data, announced by President Obama earlier today, is that the United States has met the President’s goal of ensuring 98 percent of the country has access to wireless broadband at a speed of at least 6 megabits per second (Mbps) down/1.5 Mbps up. Other key findings from the June 30, 2014 dataset include:
- As we have seen in every data release since our first in February 2011, broadband speeds continue to increase. The rate at which we are seeing speeds increase, however, is slower at every national speed threshold that we track.
- At lower speeds, Internet access is widely available across both rural and urban areas. The latest data shows that 99 percent of the country has access to advertised broadband speeds at 10 megabits per second (Mbps) through either wired or wireless services, and 93 percent have access to this speed through wired service alone.
- Nearly 85 percent of the country has access to wired broadband at a speed of 25 Mbps down and 3 Mbps up, which is the Federal Communications Commission’s (FCC) new benchmark level for broadband speeds. Cable provides 82.69 percent of the U.S. population with speeds of 25 Mbps or more, while fiber to the premises serves about one in four Americans (24.20 percent) at that speed.
- However, there is still a big gap between urban and rural areas when it comes to access to broadband at 25 Mbps. The latest data finds that only 55 percent of those in rural communities, and 32 percent of tribal lands have access to broadband at 25 mbps compared with 94 percent of urban areas.
NTIA’s State Broadband Initiative (SBI), which funded grants to collect the data used in the Broadband Map, is coming to a close. The data we are posting today is the last set of data that states will collect under this program. NTIA is transitioning the broadband map to our long-standing partner, the FCC, which will collect data as part of its 477 data collection program.
In addition to collecting this valuable broadband data, SBI grantees have accomplished a tremendous amount over the last five years. They have created more than 200 local broadband planning teams, which brought together diverse stakeholders to assess resources, identify gaps and plan their broadband future. Many states convened state broadband councils that helped chart a path for how their state will approach the digital economy. Grantees have worked with schools, non-profit organizations, libraries and local governments – providing digital literacy training, on-site technical support and technology planning services. And they also have played a key role in helping to redefine online government services. For example, Massachusetts has created an online tool known as Mass Vets Advisor to help veterans navigate the many state, federal and private-sector benefits available to them because of their military service.
As we move forward, many states have said they plan to continue collecting or analyzing data, and will continue to maintain their own broadband maps. A majority of states also will continue to employ a broadband coordinator or are integrating that work into other important planning activities. NTIA will continue to support the work of these groups by facilitating a State Broadband Leaders Network, enabling state broadband coordinators to continue sharing information with each other and leveraging their knowledge to expand broadband in their states. We are very excited to continue supporting this important work as we promote access to broadband through our BroadbandUSA initiative. This effort is aimed at providing technical assistance and guidance to help communities assess local broadband needs, engage stakeholders, explore business models, evaluate financing options and attract private-sector investment.
To see more broadband map statistics, go to www.broadbandmap.gov/analyze, download the data or use our APIs.